HDFCBANK Timeseries Option Chain | Historical Snapshots & OI Replay
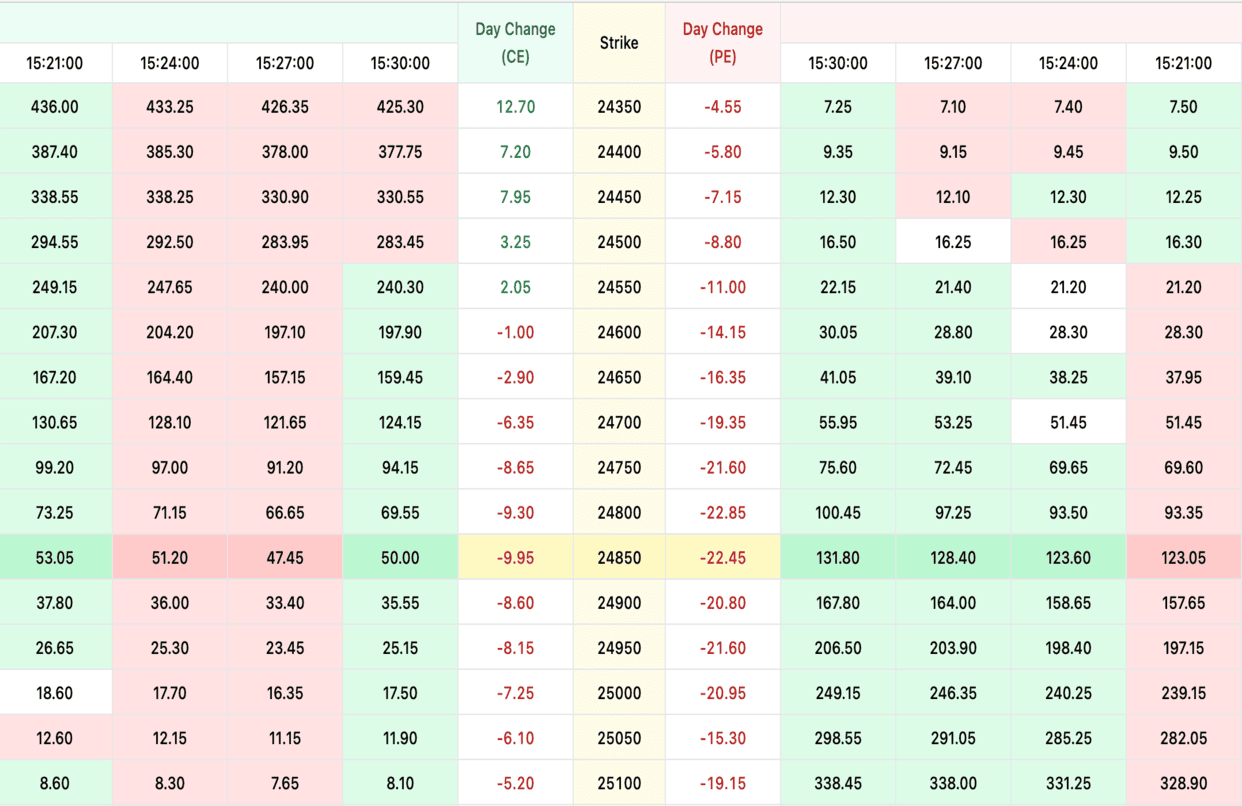
The timeseries option chain for HDFCBANK lets you pick any past trading date and any minute within that session, and replay the full option chain exactly as it looked — strike-by-strike open interest, volume, premiums, IV, and Greeks, all captured as they streamed live on NSE. Instead of looking at a single end-of-day snapshot, you can scrub through the day and watch how institutional positioning evolved in HDFCBANK options minute by minute.
This is a research-grade feature for HDFCBANK option traders. Back-test how max pain shifted in the final week of a monthly expiry. Study how option writers responded to a sharp intraday spike. Reconstruct OI buildup around a budget day, RBI policy, or an earnings announcement that moved HDFCBANK. The data you see in the chain is the same data live traders had at that moment — not a reconstructed estimate — so your conclusions about what worked, what failed, and why are built on actual historical market state.
Practical uses of the HDFCBANK timeseries option chain
Systematic traders use the HDFCBANK timeseries chain to build strategy back-tests that don't rely on end-of-day closes — most option strategies live or die on intraday behaviour. Discretionary traders use it to study specific past setups in detail: "How did the HDFCBANK option chain behave on the day of the last RBI decision?" is a question you can answer concretely instead of from memory. Journaling an old HDFCBANK trade becomes possible too — you can see exactly the option chain conditions you were looking at when you entered.
Pair the timeseries option chain with our Live Option Chain, Max Pain Calculator, and Open Interest Analysis for a complete HDFCBANK option-market research stack on NSE.
HDFC Bank Ltd (HDFCBANK) Timeseries Option Chain: Pro Tips
Tip 1: compare today to past similar days on HDFCBANK
Every morning, pull up the Timeseries tool and find a past day with similar conditions to today. Similar position in expiry cycle, similar IV, similar market direction. Studying how that day unfolded gives you informed expectations for today. It takes 2-3 minutes but adds meaningful context.
Tip 2: build a pattern playbook
Document the patterns you find across many historical sessions. "Setup X led to outcome Y in 8 out of 12 cases." "Pattern Z failed in volatile weeks but worked in calm weeks." These documented observations become your personal playbook, more valuable than any generic trading guide.
Tip 3: review your trades historically on HDFCBANK
For every significant trade you take, later review what the option chain looked like at your entry time. Use the Timeseries tool to see the exact conditions. Honest review of your trade decisions — both winners and losers — is how you improve fastest. The tool makes this review easy.
Tip 4: stay consistent as of 13 October 2026
Historical study compounds over time. A trader who spends 20 minutes weekly for a year has done 17 hours of focused study on HDFC Bank Ltd option patterns — far more than most retail traders. This sustained effort produces real edge. Generic guides teach theory; disciplined historical study teaches reality. As a NIFTY and BANKNIFTY and FINNIFTY constituent, HDFC Bank Ltd rewards the trader who commits to learning from the past.
HDFC Bank Ltd (HDFCBANK) Timeseries Option Chain: Data Quality
How accurate is historical HDFCBANK data?
Historical option chain data in the Timeseries tool comes from NSE's official feeds. It is the same data the exchange uses for clearing and settlement, meaning it is highly accurate. What you see in historical mode is what actually happened on those trading days, not estimated or reconstructed values.
Understanding data granularity
Depending on the tool and the date, historical data may be available at different granularity — end-of-day snapshots, hourly snapshots, or minute-by-minute ticks. Intraday patterns are only visible in higher-granularity data. For quick overviews, end-of-day is enough. For detailed pattern study, higher granularity is better.
Data coverage for HDFCBANK
As a NIFTY and BANKNIFTY and FINNIFTY constituent, HDFC Bank Ltd has extensive historical options data going back multiple years. This deep archive supports thorough pattern study. Less active symbols may have thinner historical data. Check the tool's date range to understand what is available for your specific HDFCBANK analysis.
Data limitations as of 13 October 2026
Data only reflects what actually happened — it does not show what hypothetical alternative scenarios would have produced. It also does not eliminate hindsight bias; you know what happened next when reviewing. Be honest about this bias when drawing lessons from historical data for future decisions.
HDFC Bank Ltd (HDFCBANK) Timeseries Option Chain: Strike Level Evolution
Tracking HDFCBANK strike-level changes over time
Individual strikes have their own stories. A specific HDFC Bank Ltd strike may have been quiet for weeks, then suddenly accumulate heavy OI, then become a key support or resistance level. The Timeseries tool lets you watch these evolution stories for any strike you are interested in.
Spotting accumulation at specific strikes
Pick a strike and pull up its history. Over several days, did OI grow slowly and steadily? That is accumulation — likely institutional. Did OI jump suddenly in one session? That is a block trade or institutional order. Each pattern has different implications for price behaviour.
Distribution at specific strikes on HDFCBANK
Distribution is the opposite — a strike that was dominant suddenly sees OI decline. The Timeseries tool shows this gradually. Recognizing distribution early lets you anticipate the end of a level's influence on HDFC Bank Ltd price.
Using strike history for live decisions as of 13 October 2026
When a key strike appears in today's live analysis, check its history. How did it behave last time it was prominent? Did price bounce from it? Did it break? This context from past behaviour improves your prediction for today's outcome. Historical data turns guessing into informed analysis.
HDFCBANK option chain evolution: quick reference
| Intraday pattern at a strike | How it looks on the replay | What it usually means |
|---|---|---|
| Steady OI build, flat/falling premium | OI rises through the day, premium drifts lower | Writers defending the strike — a wall forming (support at a put, resistance at a call) |
| OI and premium rising together | Both climb across the session | Buyers accumulating — positioning for a move toward that strike |
| Sudden OI unwind | OI drops sharply within minutes | Wall abandoned or short-covering; the level may no longer hold |
| OI flat, premium spiking | OI barely moves while premium jumps | IV expansion / fear around an event, not fresh positioning |
| OI and premium both falling | Both decline into the close | Long liquidation or profit-booking; interest leaving that strike |
| OI build migrating to a new strike | OI drains one strike and builds at the next | Wall being rolled — support/resistance shifting with spot |
Read the HDFCBANK chain like a movie, not a photo: the direction and speed of change at a strike reveals intent better than its size at any single moment. A wall built slowly and held all day is far more reliable than one that appears in the final hour. Scrub back to the open to see which strikes gained interest first.
How to use the Timeseries Option Chain
- Pick a symbol and a past date — Choose Nifty, BankNifty, or any F&O stock. Pick the trading date you want to study from the calendar.
- Choose the expiry to inspect — Weekly expiries replay differently from monthly. Match the expiry that was live on the date you picked.
- Scrub through the session — Use the time slider or playback controls to move minute by minute. Watch how OI, premium, and IV evolved through the day.
- Pause at the moments that matter — Stop at the 9:15 open, RBI announcement window, FII data release, or any moment that mattered to your trade. Read the chain as it was.
- Cross-reference with max pain or smart OI — Open the same date in our Max Pain or Smart OI tools to see how those signals were behaving alongside the chain.
HDFCBANK Timeseries Option Chain — Frequently Asked Questions
What is HDFCBANK timeseries option chain?
The HDFCBANK timeseries option chain replays historical snapshots of the NSE option chain at 1-minute granularity, so you can see how open interest, volume, premium and IV at each strike evolved through a past session. Instead of one end-of-day view, you scrub the whole day and watch when positions in HDFCBANK options were built or unwound.
How to use HDFCBANK timeseries data?
Pick a past date and expiry, then step through the session minute by minute. Watch a strike's open interest and premium together: a steady OI build with flat or falling premium means writers are defending that HDFCBANK level, while a sudden OI drop signals the wall being unwound. Pause at the open, event windows, or your old entry to read the chain as it was.
How do I spot an OI wall being built or abandoned in HDFCBANK?
Scrub forward and track one strike's open interest across the day. OI climbing hour after hour marks a wall being built — support at a put strike, resistance at a call strike. If that OI suddenly drops, the wall is being unwound or defended into expiry. Watching the HDFCBANK build-then-unwind sequence is far more telling than the closing number alone.
What does falling premium with rising OI mean on the HDFCBANK chain?
On the HDFCBANK timeseries chain, premium falling while a strike's open interest keeps rising is classic option writing — sellers are adding positions and pocketing decay, betting the level holds. When premium and OI rise together instead, buyers are accumulating, often ahead of an expected move. Replaying the minute-by-minute order of these changes shows which side was in control.
How often does the HDFCBANK timeseries chain update and how far back does it go?
Snapshots are stored at 1-minute intervals for every NSE session and go back multiple years for Nifty, BankNifty and major F&O names, with thinner coverage for recently added stocks. During market hours the current HDFCBANK session streams live; afterwards any past date can be replayed exactly as it printed, with no smoothing or interpolation.
Learn more
Read our guide: What Is an Option Chain? How to Read It (India Guide)