ICICIBANK Multi-Strike Chart | Live Multi-Strike Premium
The multi-strike chart for ICICIBANK lets you overlay the premium behaviour of several strikes on a single chart — both calls and puts, across expiries — so you can see how each strike is reacting to spot movement, theta, and changes in implied volatility. Instead of switching between individual strike charts, you get a unified view of the whole ICICIBANK option chain's price action in one place.
This is particularly powerful for ICICIBANK traders running multi-leg strategies. Watch an iron condor's four legs at once to understand real-time P/L dynamics as spot drifts toward a short strike. Track a ratio spread's break-even point by watching both strikes move together. Compare how deep-OTM vs near-ATM ICICIBANK calls respond to the same underlying move, and see the volatility skew reflected in premium behaviour rather than theoretical IV numbers.
Using ICICIBANK multi-strike data for strategy construction
Before building a ICICIBANK strategy, overlay the strikes you're considering on one chart and study how their premiums have moved together (or diverged) over the session — or historically. If two strikes that should move in tandem start diverging, that's often a pricing anomaly you can trade. For direction-based plays, you can quickly identify which strike gave the best risk-reward for past ICICIBANK moves and apply the same filter to today's setup. Live mode streams every selected ICICIBANK strike in real time.
Complement the multi-strike chart with our ATM Straddle, Premium Decay, and Live Option Chain tools for richer ICICIBANK option-market analysis on NSE.
ICICI Bank Ltd (ICICIBANK) Multi-Strike Chart: Relative Value Analysis
What is relative value in options?
Relative value compares the price of one option against another to find mispricings. Two ICICI Bank Ltd options at adjacent strikes should move in predictable proportion based on delta and gamma. When the proportion breaks, one option is relatively expensive or cheap compared to the other. Spotting these breaks is the foundation of spread trading on ICICIBANK.
How to spot relative value on the ICICIBANK chart
Look for moments when one strike's line diverges from the others. If the ATM call is rising while the slightly OTM call is flat, the spread between them is compressing — a sign the OTM call may catch up. If the opposite happens, the ATM is running too fast. Relative value trades profit from these reversions. The chart makes the divergences visible in real time.
Spread opportunities in ICICIBANK multi-strike
Spread strategies (bull call spread, bear put spread) involve buying one strike and selling another. The multi-strike chart helps choose which strikes to pair. Pick a strike that is relatively cheap (lagging) as the long leg and a relatively expensive (leading) strike as the short leg. This timing approach captures the differential on top of the strategy's directional edge.
Using ICICIBANK relative value as of 13 October 2026
Open the multi-strike chart and watch the spacing between lines. Tight spacing means strikes are moving together (normal). Widening spacing means divergence is emerging. Sudden wide jumps signal mispricing opportunities. For ICICI Bank Ltd, these setups appear multiple times per session during active trading windows.
ICICI Bank Ltd (ICICIBANK) Multi-Strike Chart: Custom Strike Selection
Why pick strikes manually for ICICIBANK?
Default strike selection is usually ATM plus adjacent strikes, which works for general analysis. Custom selection is better when you have a specific trade thesis. If you are planning a butterfly at 22500, pick 22400, 22500, and 22600 to track the exact legs. If you are watching a breakout, pick strikes above the current resistance to see when fresh positioning hits those levels.
Strikes for range-bound ICICIBANK analysis
For range-bound trading, pick strikes at and just outside the expected range. If ICICI Bank Ltd is trading between 22400-22700, pick strikes at 22400, 22500, 22600, and 22700. The chart shows whether the range is holding (lines stay stable) or breaking (one strike starts moving away from the others).
Strikes for directional trade tracking
For a directional trade, pick strikes along the expected move. If you are bullish and expect ICICIBANK to reach 22800, pick 22500, 22600, 22700, and 22800. You can watch how the premium at 22800 changes as price approaches — a leading indicator for position management.
Rebalancing strike selection as ICICIBANK moves
Your strike selection becomes stale if ICICI Bank Ltd moves significantly. Update it once per day or whenever price moves 1-2% from your original centre. As of 13 October 2026, fresh strike selections produce cleaner signals than stale ones.
ICICI Bank Ltd (ICICIBANK) Multi-Strike Chart: Frequently Asked Questions
What data does the ICICIBANK multi-strike chart show?
The chart plots option premium for selected ICICI Bank Ltd strikes over time. You see each strike as a separate line on the same time axis. Values update in real time during NSE market hours and can be replayed for any past date in historical mode. The core use case is comparing strikes rather than analysing one in isolation.
How often does the chart update for ICICIBANK?
Live mode updates every minute (or faster) during market hours. Each new minute adds a data point to every strike line. Historical mode is static — the data is fixed for past dates. For ICICI Bank Ltd intraday traders, the live updating is essential for timely decisions.
Can I save my ICICIBANK strike selection?
Most sessions remember your selected strikes within a browsing session. If you log in, preferences may persist across days. For consistent analysis, pick a standard set of strikes that you watch every day — the consistency helps you notice unusual activity faster.
What other tools complement ICICIBANK multi-strike?
Multi-strike works best with the option chain (snapshot view), multi-strike OI (open interest comparison), and the price chart (direction context). Together these tools cover every dimension of the ICICI Bank Ltd options market. As of 13 October 2026, sophisticated traders use all four in combination.
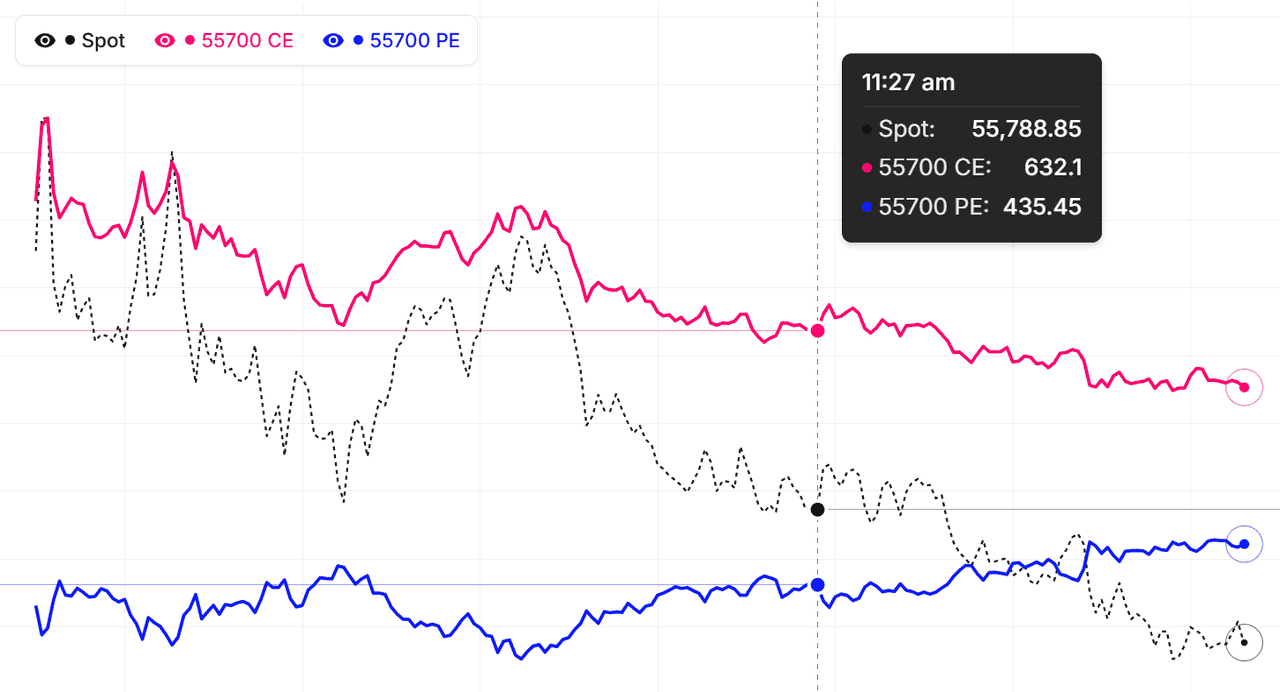
ICICIBANK premium comparison across strikes: quick reference
| Strike zone | Typical delta | How its premium line behaves on the overlay |
|---|---|---|
| Deep ITM | Above 0.90 | Tracks the ICICIBANK future almost point-for-point; flattest decay, mostly intrinsic value |
| ITM | 0.60 – 0.80 | Strong directional response to spot with modest time decay between moves |
| ATM | ~0.50 | Highest gamma and theta — the fastest-swinging and fastest-decaying line on the chart |
| OTM | 0.20 – 0.40 | Rises only on sustained trend or IV expansion; bleeds steadily when ICICIBANK consolidates |
| Deep OTM | Below 0.20 | Near-flat most sessions; spikes on sharp spot moves or vol events, then decays back |
Because every ICICIBANK strike carries a different delta, gamma, and theta mix, their premium lines never move identically — the overlay makes those differences visible. Compare each strike's actual line against the behaviour expected for its zone: a line moving out of character is often the first sign of a volatility-skew shift or a tradeable pricing anomaly.
How to use the Multi-Strike Chart
- Pick the underlying and expiry — Choose Nifty, BankNifty, or any F&O stock. Pick the expiry that holds your strikes.
- Add the strikes you want to overlay — Click strikes on the option chain or type them in. Up to 8-10 strikes can plot cleanly together.
- Choose call, put, or both — Toggle each strike between CE, PE, or both. Colour-coding makes it easy to track each line.
- Pick live or historical mode — Live for current-session monitoring. Historical for back-testing or post-mortem analysis on past trades.
- Read the divergence signals — Strikes that should move in tandem but are diverging often signal pricing anomalies or skew shifts. Both are tradeable in the right context.
ICICIBANK MultiStrike Chart — Frequently Asked Questions
What is ICICIBANK MultiStrike Chart?
ICICIBANK MultiStrike Chart displays multiple option strikes on a single chart, allowing you to compare price movements across different strikes simultaneously for better trading decisions.
How to use MultiStrike Chart for ICICIBANK?
Select multiple ICICIBANK strikes you want to track. Compare how different strikes react to underlying moves. Identify which strikes offer better risk-reward based on price behavior patterns.
What does it mean when two ICICIBANK strikes diverge on the multi-strike chart?
Divergence between ICICIBANK strikes that normally move in tandem usually signals a volatility-skew shift or a pricing anomaly. If an OTM put premium climbs while the ATM stays flat, put-side IV is being bid — a fear signal. Spread traders treat sustained divergence as a relative-value setup: buy the lagging strike, sell the leading one.
How many ICICIBANK strikes can I overlay at once?
You can overlay up to 20 ICICIBANK strikes simultaneously, though 5-8 strikes centred on the ATM plot most cleanly. Each line is colour-coded, and every strike can be toggled between CE, PE, or both — across weekly and monthly expiries. Deep-OTM strikes on illiquid names add noise, so stick to actively traded strikes for readable comparisons.
How often does the ICICIBANK multi-strike chart update?
During NSE market hours (9:15 AM to 3:40 PM IST) every selected ICICIBANK strike refreshes every minute from live option-price data. Outside market hours the chart shows the last traded session, and historical mode lets you replay any past ICICIBANK expiry to back-test how each strike behaved intraday.