TCS Call vs Put Open Interest | Live Sentiment Chart
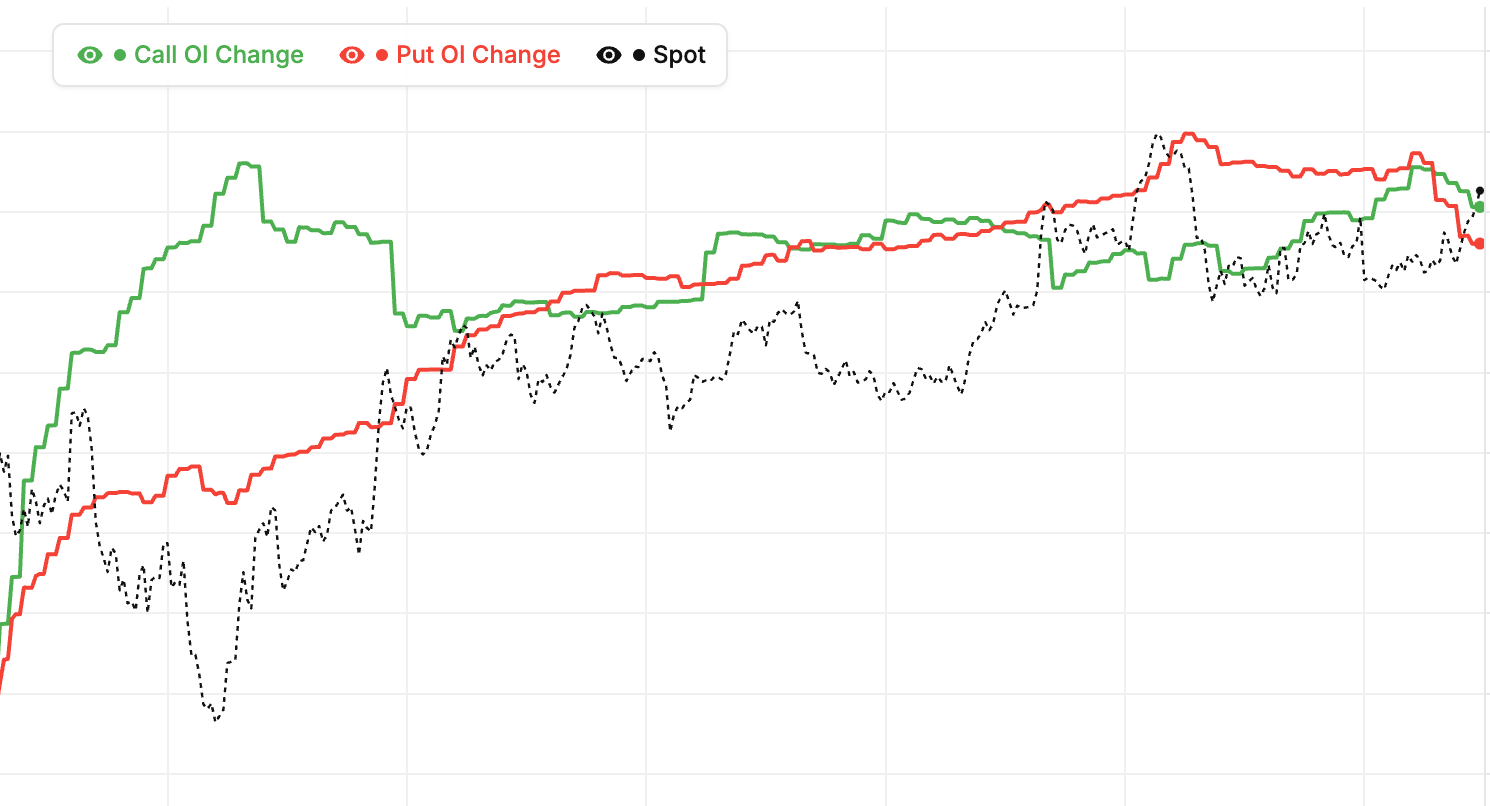
Call vs Put OI for TCS is the cleanest real-time read on sentiment positioning in the option market. When total put OI is rising faster than call OI, institutional writers are defending lower strikes — typically a bullish positioning for TCS. When call OI outpaces put OI, the ceiling is getting heavier and upside momentum tends to stall. Our chart plots both series side by side so the divergence is obvious at a glance.
The underlying Put-Call Ratio (PCR) derived from TCS OI distribution is one of the most-followed sentiment metrics in Indian F&O. PCR above 1.3 usually signals heavy put writing (bullish), below 0.7 signals heavy call writing (bearish), and readings between 0.9 and 1.1 are neutral zones where the market waits for a directional catalyst. We calculate TCS PCR live from the NSE option chain and update it across the full trading session, including each expiry separately so weekly and monthly positioning are never conflated.
Reading the TCS call-vs-put OI battle intraday
Watch the TCS call-put OI gap during the first hour of trade. Institutional option writers commit their positioning early, and the direction of that first-hour commitment often sets the day's bias. If the gap widens in puts' favour while spot holds, that's confirmation of bullish intent. If calls keep adding into a rally, the rally is usually being sold into. The live mode streams updates throughout the NSE F&O session so you can react as positioning changes.
Pair Call vs Put OI with our PCR Tracker, Max Pain Calculator, and Live Option Chain for complete TCS positioning context on NSE.
TCS Live Call vs Put OI Analysis
Compare total call and put open interest for TCS across the strike window you choose, with the futures price on the same time axis. The Total OI chart shows the standing positions on each side; the OI Change chart isolates what has been added or unwound today, measured from the day's open. Read together they separate legacy positioning from today's fresh commitment.
Understanding TCS Call vs Put OI and the Put-Call Ratio
Most option writing in TCS is institutional. When put OI pulls away from call OI, large desks are committing capital to defend lower strikes — usually read as bullish positioning. The reverse pattern means the ceiling is getting heavier and rallies are being sold into. Because both lines are plotted against the future, you can see immediately whether a price move is being backed by fresh writing or fought by it.
The summary bars above the charts give the current call and put totals alongside the day's change, so the balance is readable at a glance. Narrow the strike window to ATM ± 5 to focus on where the intraday battle actually happens, or widen it to All to judge the full expiry. Pair this with our PCR Tracker, Max Pain Calculator, and Call vs Put Volume to confirm whether the day's OI shift was backed by real traded volume.
Tata Consultancy Services Ltd (TCS) Call vs Put OI: Session Dynamics
How the TCS ratio changes intraday
The Call vs Put OI ratio updates through the day as traders create and close positions. Morning activity sets the day's initial bias. Mid-day is usually stable. Afternoon activity — especially the final hour — often causes meaningful shifts as institutions position for the next session. Watching the intraday evolution is more useful than a static snapshot.
Opening-hour patterns on TCS
The first 30-60 minutes reveal overnight institutional decisions. Rapid changes in call or put OI during this window indicate fresh positioning. Growing put OI in the morning is bullish; growing call OI is bearish. Use this opening pattern to confirm or adjust your pre-market bias.
Final-hour patterns on TCS
In the last hour (2:30-3:30 PM), institutional traders make their end-of-day positioning moves. Watch for significant OI shifts — they often predict the next session's direction. A strong shift in the final hour is one of the most reliable signals the chart generates.
Session-long observation on TCS as of 23 October 2026
At the end of each trading day, note how the Call vs Put OI ratio evolved. Did it start balanced and shift bullish? Start bearish and reverse? These session-long patterns build your intuition over time. Consistent observation is the fastest path to skill.
Tata Consultancy Services Ltd (TCS) Call vs Put OI: Strike Distribution
What does TCS OI distribution reveal?
Beyond the total call vs put OI, the distribution across strikes matters. Is OI concentrated at a few strikes or spread across many? Concentrated OI indicates strong conviction at specific levels — those strikes matter. Spread OI indicates uncertainty or broad hedging — the specific levels matter less individually.
Concentrated TCS OI patterns
When put OI is concentrated at one or two strikes just below current price, support is narrowly defined. Expect strong reactions at those specific levels. When call OI is concentrated at specific strikes above, resistance is sharp. These narrow concentrations often act as magnets or walls for price action on Tata Consultancy Services Ltd.
Spread TCS OI patterns
When OI is spread across many strikes, no single level dominates. Price can move more freely without encountering strong resistance or support. These environments are more suitable for trend trading than level-based trading because the chart does not offer sharp entry or exit points.
Reading distribution as of 23 October 2026
Look at the Call vs Put OI chart not just for totals but for how the OI is distributed across strikes. Concentrated distributions call for level-based strategies. Spread distributions call for trend or range strategies. Adapting to the distribution improves your strategy fit on TCS.
Tata Consultancy Services Ltd (TCS) Call vs Put OI: Combining With Technical Analysis
Why combine with chart patterns on TCS
Technical chart patterns (head and shoulders, flags, triangles) combined with Call vs Put OI produce stronger setups than either alone. A bullish chart pattern backed by rising put OI has high conviction. A bearish pattern backed by rising call OI is similarly strong.
Support tests with OI confirmation on TCS
When Tata Consultancy Services Ltd tests a technical support level, check the Call vs Put OI chart. Is put OI rising at that strike? If yes, fresh defenders are arriving — bounce likely. If put OI is falling, support is weakening — be cautious. This combined analysis beats pure technical trading.
Resistance tests with OI confirmation
Similarly for resistance. A technical level with rising call OI is strongly defended. A technical level with falling call OI is crumbling. The OI context tells you whether the technical level still has weight or has been abandoned.
Building a combined workflow on TCS as of 23 October 2026
Open the price chart alongside the Call vs Put OI chart. Start with technical analysis to identify key levels. Then check OI to confirm whether those levels are being defended. Only trade when both agree. This workflow takes 3-5 minutes per trade setup but dramatically improves quality.
TCS call vs put OI patterns: quick reference
| OI pattern | Positioning | Common reading |
|---|---|---|
| Put OI rising faster than call OI | Put writers committing | Bullish bias; lower TCS strikes being defended |
| Call OI rising faster than put OI | Call writers committing | Bearish bias; overhead resistance building on TCS |
| Both sides rising sharply | Two-sided writing | Volatility expected; event positioning before a catalyst |
| Put OI unwinding while calls add | Support being abandoned | Warning for bulls; rallies likely to be sold into |
| Put OI crossing above call OI | Bullish regime crossover | High-conviction sentiment shift favouring TCS upside |
These patterns describe how NSE option writers typically commit capital, not mechanical rules — always confirm against the TCS futures line plotted on the same chart. The live view above refreshes every minute during market hours, and the change-in-OI panel isolates today's fresh writing so you can spot which pattern is forming in real time.
How to read Call vs Put OI
- Pick symbol and expiry — Choose Nifty, BankNifty, or any F&O stock and select the expiry cycle you want to analyse.
- Watch first-hour slope — Note how call OI and put OI are moving in the opening hour. Faster-growing put OI is bullish commitment; faster-growing call OI is bearish.
- Check the PCR reading — The Put-Call Ratio derived from the chart gives an instant sentiment read. Above 1.3 bullish, below 0.7 bearish, 0.9-1.1 neutral.
- Spot regime changes — Watch for crossovers — moments when put OI rises above call OI (or vice versa). These often mark high-conviction directional shifts.
- Confirm with price — High-conviction setups require OI direction and price direction to agree. When they disagree, wait for confirmation before entering.
TCS Call vs Put OI — Frequently Asked Questions
What is the TCS Call vs Put OI chart?
The TCS Call vs Put OI chart plots total call open interest against total put open interest from the live NSE option chain, alongside the futures price. Because the two OI lines sit side by side, you can see instantly which side option writers are loading up on and how the TCS sentiment balance shifts through the session.
What does rising put OI vs call OI mean for TCS?
Put OI rising faster than call OI is typically bullish for TCS. Option writing on NSE is dominated by institutions, and put writers only add positions at strikes they expect to hold — so accelerating put OI means lower levels are being defended with real capital. When call OI grows faster instead, the ceiling above TCS gets heavier and rallies tend to stall.
What is a call-put OI crossover on TCS?
A crossover happens when total put OI moves above total call OI on the TCS chart, or vice versa. It marks a regime shift in positioning: the side that takes the lead usually sets the near-term bias. Crossovers confirmed by a matching move in the TCS futures price are far higher-conviction signals than crossovers that price ignores.
Should I track total OI or change in OI for TCS intraday?
Use the change-in-OI view for TCS intraday: it resets each session, so it isolates only the fresh call and put writing committed today. Total OI is cumulative and moves slowly, which makes it better for judging multi-day positioning and expiry-week structure. StockMojo plots both TCS views one below the other so you can compare them directly.
How often does TCS Call vs Put OI data update?
During NSE market hours (9:15 AM to 3:40 PM IST) the TCS Call vs Put OI chart refreshes every minute from live option chain open interest. Outside market hours it shows the last traded session, and historical mode lets you replay call vs put OI for any past TCS trading day and expiry.
Learn more
Read our guide: What Is Open Interest in Options? A Trader's Guide