NIFTY Straddle & Strangle Option Chain 2026 - Live CE+PE Premiums & Breakevens
Live and historical NIFTY straddle and strangle option chain. Every row shows the call LTP, put LTP and combined premium for a strike or strike pair, with change against the selected time cycle, lower and upper breakevens and the breakeven range as a percentage of spot. Switch between Straddle and Strangle, or to Historical mode to replay any past date.
Nifty 50 (NIFTY) Straddle & Strangle Chain in Historical Mode
What can you learn from past NIFTY straddle data?
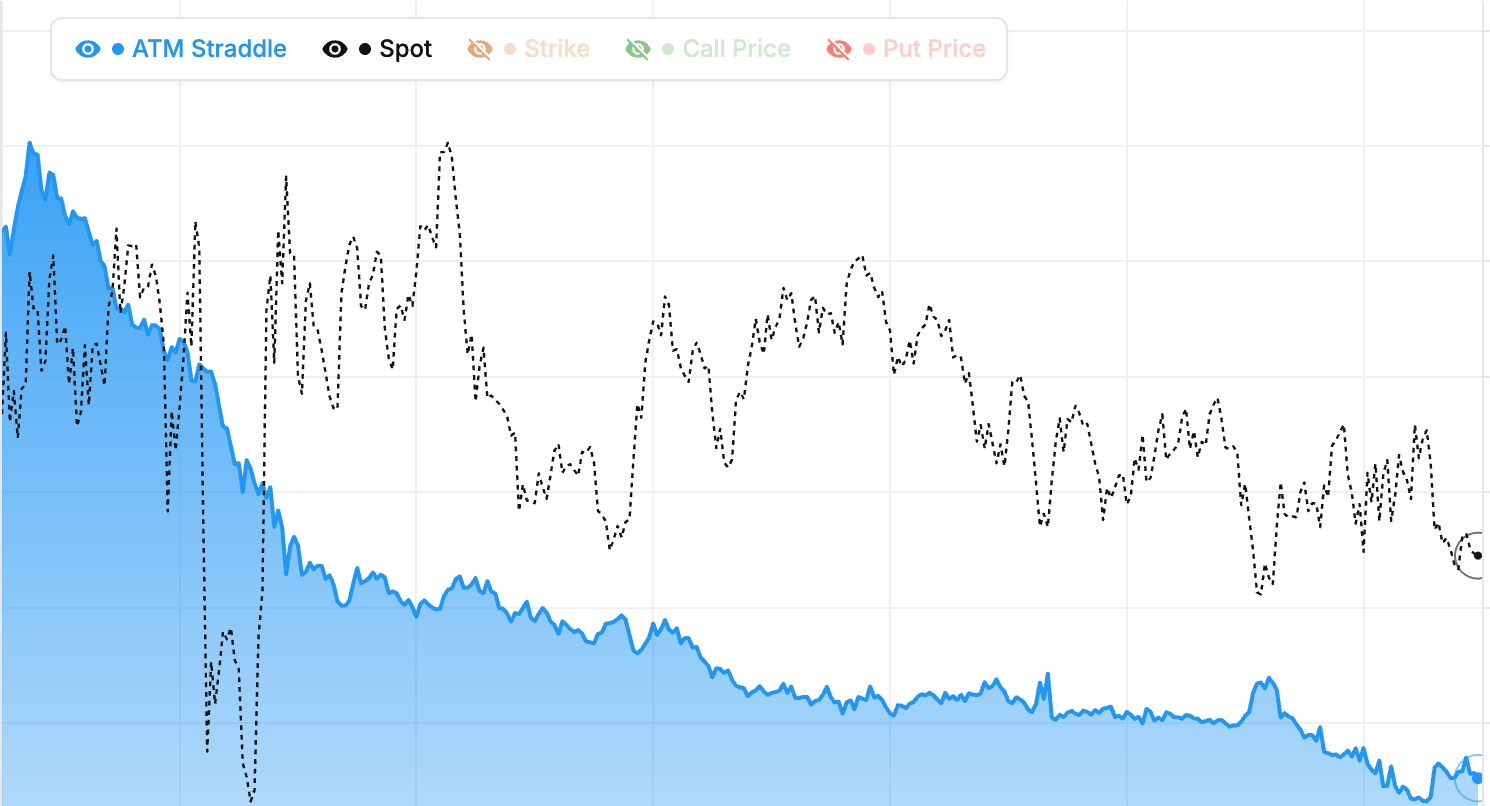
Historical mode loads the NIFTY option chain as it stood at any minute of any past trading day and rebuilds the straddle and strangle table from it. That turns the page into a back-testing tool. Pick a past expiry day for Nifty 50 and step through the morning to see how fast the ATM straddle decayed, or load the day before a major event to see how much premium the market was charging and compare it with the move that actually followed.
Checking whether NIFTY premiums were rich or cheap
Take the ATM straddle premium on a past date, note its Range %, then check how far NIFTY actually travelled by expiry. If the realised move was consistently smaller than the breakeven range, sellers were being paid well during that period. If the move regularly exceeded the range, buyers had the edge. Repeating this across several expiries of Nifty 50 gives you a feel for how the market prices this underlying, which is far more useful than a generic rule about selling or buying volatility.
Replaying a strangle trade minute by minute
Use the step buttons in historical mode to move forward in one minute, five minute or one hour jumps. Watch an OTM2 strangle row on NIFTY from the open to the close of a past session and you will see the combined premium decay on a quiet day or spike when the underlying approached one of the strikes. This is the fastest way to build intuition for how a short strangle on Nifty 50 feels in real time, without putting capital at risk.
Combining historical straddle data with OI
Open the regular option chain for the same past date alongside this table. The strikes with the heaviest call and put OI often act as the edges of the day's range, and the straddle and strangle breakevens tell you whether option prices agreed with that range. When breakevens were inside the OI walls and NIFTY stayed inside them too, short strangle sellers had an easy day. Finding those patterns in Nifty 50 history helps you recognise them live.
Nifty 50 (NIFTY) Straddle & Strangle Option Chain: Common Questions
Which ATM is used for the NIFTY straddle chain?
The ATM row follows the same setting as the main option chain: the strike closest to the spot price by default, or the strike closest to the futures or synthetic futures price if you have changed the ATM method in the option chain settings. For Nifty 50 the spot and futures ATM usually agree, but near expiry or when the futures carry a large premium they can differ by one strike, which shifts every OTM pair in the strangle view by one step as well.
How many strikes does the table show?
The number of rows above and below ATM follows the strikes around ATM setting from the option chain, so the NIFTY straddle view covers the same window you see in the chain. In strangle mode the same window applies to the call strike and the put strike mirrors it on the other side. The table scrolls to the ATM row when you load a symbol or change the expiry, so the most important row is always in view first.
Why does a NIFTY row show a dash instead of a premium?
A dash means one leg of the pair has no last traded price for this expiry, usually a far OTM strike that has not traded today or a newly listed strike. The combined premium is not shown rather than shown with one side missing, because a straddle or strangle price built from a single leg would be misleading. On liquid Nifty 50 expiries this only happens at the far ends of the table.
Can the straddle chain replace the option chain?
No, they answer different questions. The NIFTY option chain shows where positions sit through OI, volume and Greeks at each strike. The straddle and strangle chain shows what a two-legged neutral position costs and where it breaks even. Most traders use both: the chain to pick the levels that matter for Nifty 50, this table to price the position that trades around those levels. As a major Broad Market index on NSE, NIFTY has enough liquidity that the LTPs shown here are close to executable prices during market hours.
Nifty 50 (NIFTY) Straddle & Strangle Option Chain: Reading the Premium Ladder
What does the NIFTY straddle option chain show?
A normal option chain lists calls on one side and puts on the other and leaves the adding up to you. The NIFTY straddle option chain does that addition for every strike. Each row is one strike with its call LTP, its put LTP and the combined premium you would pay to buy both, or collect to sell both. The ATM row is highlighted because the ATM straddle is the single most watched number in Nifty 50 options: it is the market's own estimate of how far the underlying can travel before expiry. Rows above and below ATM show how quickly that combined premium changes as you move away from the current price.
How is the NIFTY strangle view different?
Switch the toggle to Strangle and the rows stop being single strikes and become strike pairs. OTM1 pairs the call one strike above ATM with the put one strike below, OTM2 pairs the next strike out on each side, and so on. ITM1 is the reverse pair, a call below ATM with a put above it, which traders call a guts strangle. The Strangle column is the combined premium of the pair. Reading down the OTM rows you can see exactly how much credit each extra strike of distance gives up, which is the core decision in building a short strangle on Nifty 50.
What do Lower BE, Upper BE and Range % mean?
Lower BE is the put strike minus the combined premium and Upper BE is the call strike plus the combined premium. Between those two prices a short straddle or strangle finishes in profit at expiry, and a long one finishes in loss. Range % expresses the gap between the two breakevens as a percentage of the current NIFTY price, so you can compare a wide strangle on a quiet day with a tight straddle on an event day without doing the division yourself. Index traders often compare Range % against the move implied by India VIX to judge whether premiums look rich or cheap.
How to read the premium change with the time cycle
The percentage beside the Strangle or Straddle premium shows how much the combined premium has moved against the baseline selected in the time cycle dropdown. On Prev Day it is the change since the previous close, which tells you whether NIFTY straddles and strangles have expanded or decayed overnight and through the session. Switch to 15 Min or 1 Hour and the same figure becomes an intraday decay meter: a steadily negative percentage across OTM strangle rows is premium bleeding out, exactly what a seller wants to see and a buyer wants to avoid. As a major Broad Market index on NSE, NIFTY premiums react quickly to news, so the cycle view helps you separate a genuine volatility shift from normal time decay.
NIFTY straddle and strangle chain: quick reference
| Row or column | What it is | How to use it for NIFTY |
|---|---|---|
| ATM row (Straddle) | Call + put premium at the at-the-money strike | Expected move until expiry; compare with recent realised moves |
| OTM1, OTM2, OTM3 (Strangle) | Call n strikes above ATM paired with put n strikes below | Credit vs distance trade-off for short strangles |
| ITM rows (Strangle) | In-the-money call below ATM paired with in-the-money put above | Guts strangle; same breakevens as the matching OTM pair |
| Lower BE / Upper BE | Put strike minus premium / call strike plus premium | Profit zone edges for sellers, targets for buyers |
| Range % | Breakeven width as a percentage of spot | Compare cushion across strikes, expiries and symbols |
| Premium % change | Change in the combined premium vs the selected time cycle, shown beside the premium | Decay meter for sellers; IV expansion alert for buyers |
Premiums are last traded prices, so far OTM pairs on illiquid NIFTY expiries can show stale values. Confirm against the bid and ask before placing orders, and re-check the ATM row after any sharp move because every strangle pair re-centres when the ATM strike changes.
How StockMojo builds the NIFTY straddle and strangle chain
The table is derived from the same live NIFTY option chain feed as the StockMojo option chain. During market hours every row is recomputed as new ticks arrive; outside market hours it shows the last session's closing snapshot. Historical mode rebuilds the table from the full option chain snapshot at the selected minute of any past trading date.
The ATM strike follows the option chain's ATM method: the strike nearest the spot price by default, or nearest the futures or synthetic futures price if that method is selected in the option chain settings. In Straddle mode each row is one strike and the premium is call LTP plus put LTP. In Strangle mode row n pairs the call n strikes above ATM with the put n strikes below (OTMn), and ITMn is the reverse pair. The rows shown follow the option chain's strikes-around-ATM setting.
Lower BE is the put strike minus the combined premium and Upper BE is the call strike plus the combined premium. Range % is Upper BE minus Lower BE divided by the current NIFTY reference price. The percentage beside the premium is the combined premium minus the combined premium at the time cycle baseline (previous close, today's open, or the start of the selected rolling window), with the percentage measured against that baseline. A dash appears when either leg has no traded price for the expiry.
How to use the Straddle & Strangle Option Chain
- Pick a symbol and expiry — Select Nifty, Bank Nifty, Sensex or any F&O stock, then choose the expiry you want to trade.
- Choose Straddle or Strangle — Use the toggle on the right of the toolbar. Straddle shows one row per strike; Strangle shows OTM and ITM strike pairs around ATM.
- Read the highlighted ATM row — The ATM straddle premium is the expected move until expiry; its Lower BE and Upper BE are the prices the underlying must cross for a long position to pay.
- Compare OTM strangle rows — Walk down the OTM1, OTM2, OTM3 rows to see how much premium each extra strike of distance gives up and how much wider the breakeven range becomes.
- Watch the premium change with a time cycle — Set the time cycle to Prev Day, Intraday or a rolling window to see whether combined premiums are expanding or decaying while you hold a position.
NIFTY Straddle & Strangle Option Chain — Frequently Asked Questions
What is the NIFTY straddle premium?
The NIFTY straddle premium is the call LTP plus the put LTP at the same strike. The highlighted ATM row shows the at-the-money straddle, which is the market's estimate of how far NIFTY can move before expiry. Rows above and below ATM show the straddle price at every other strike in the chain.
How are NIFTY strangle strikes paired in this table?
In Strangle mode each row pairs strikes equally distant from ATM. OTM1 is the NIFTY call one strike above ATM with the put one strike below, OTM2 is the next strike out on each side, and ITM rows pair an in-the-money call below ATM with an in-the-money put above it. The Strangle column is the combined premium of the pair.
How do I find the breakeven of a NIFTY straddle or strangle?
Lower BE is the put strike minus the combined premium and Upper BE is the call strike plus the combined premium. A short NIFTY straddle or strangle is profitable at expiry if the underlying closes between the two breakevens; a long one needs a close outside them. Range % shows the width of that zone as a percentage of the current NIFTY price.
What does the percentage next to the NIFTY straddle or strangle premium show?
The percentage beside the combined CE+PE premium is its change against the baseline selected in the time cycle dropdown: the previous close on Prev Day, today's open on Intraday, or a rolling window such as 15 Min or 1 Hour. Negative values across OTM rows mean NIFTY strangle premiums are decaying; a green sweep with no move in the underlying means implied volatility is rising.
Can I see historical NIFTY straddle and strangle premiums?
Yes. Switch to Historical mode, choose any past trading date and step through the session in one minute, five minute or one hour jumps. The NIFTY table is rebuilt from the option chain snapshot at that minute, so you can replay how straddle premiums decayed on a past expiry day or how much the market charged before an event.
Learn more
Read our guide: ATM Straddle Explained: Straddle Price, Charts and the Expected Move