FINNIFTY PCR Trend | Year-long Put-Call Ratio with Futures Overlay
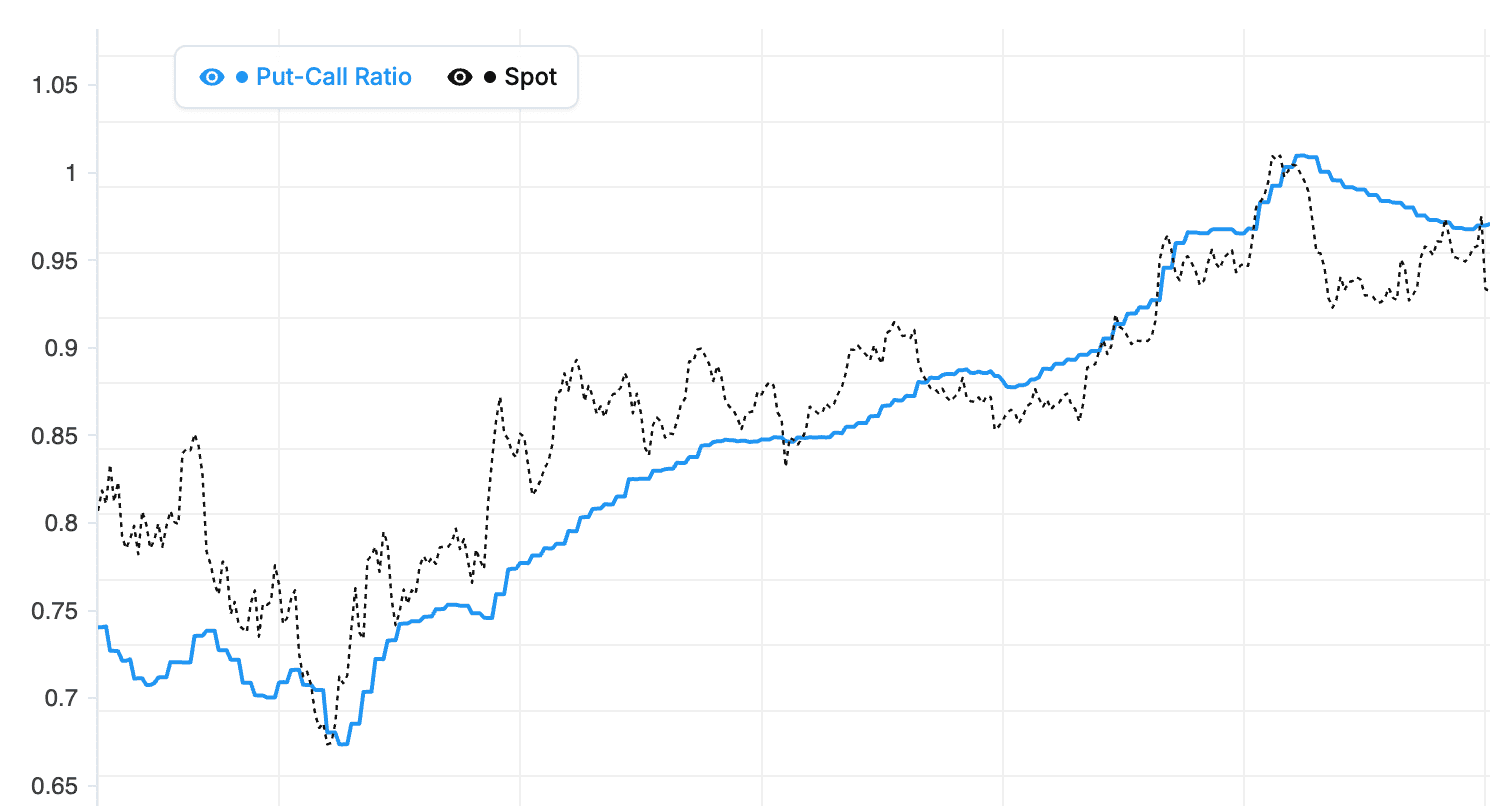
The FINNIFTY PCR Trend chart plots the daily Put-Call Ratio for FINNIFTYoptions across the last 365 trading days, alongside the monthly futures close price. Each row represents one NSE trading day: total put open interest divided by total call open interest for the smallest options expiry traded that day. By overlaying the futures price you can see at a glance whether sentiment is moving with price, leading it, or diverging. That's the kind of context a single intraday PCR snapshot can't deliver.
For indexes like Nifty and BankNifty the underlying expiry rolls weekly, so each daily PCR value reflects the nearest weekly options book. For F&O stocks the expiry rolls monthly. Either way the chart is index-aligned and gap-aware: days with no options activity are rendered as breaks rather than zero values, so the trend line stays truthful around exchange holidays and illiquid stocks.
Reading the FINNIFTY PCR trend
Sustained FINNIFTY PCR above 1.2 across multiple weeks suggests institutional put writers are defending lower levels. That's a bullish-leaning regime in the Indian market, where most option premium is sold rather than bought. Sustained PCR below 0.8 indicates call writers are dominating, hinting at caution. Extremes above 1.5 or below 0.5 have historically preceded mean-reverting moves, especially when they coincide with sharp futures-price divergences on the chart.
Use the trend chart alongside the intraday Put-Call Ratio tool for session-level detail, the Open Interest Analysis tool for strike-level context, and the Max Pain calculator for expiry pinning levels.
PCR Trend
Nifty Financial Services (FINNIFTY) PCR-vs-Futures Divergences
Why overlay futures price on the FINNIFTY PCR chart?
PCR alone is a positioning gauge, not a price gauge. By overlaying the Nifty Financial Services monthly futures close on the same time axis, the chart turns into a divergence detector. When PCR and futures move together, sentiment is confirming price — typically a continuation environment. When they diverge, one is leading the other, and the lead time is often two to five sessions. As a major Financial Services index on NSE, divergence reading is the highest-value use of this chart for short-swing traders.
Bullish divergence on FINNIFTY
Bullish divergence: FINNIFTY futures making lower lows while PCR makes higher lows. Translation — price is weakening but put writers are stepping in more aggressively at each lower level, building a floor. This is institutions taking the other side of retail panic. On Nifty Financial Services, the resolution is usually a sharp upward reversal once the futures find traction. The size of the divergence (how much PCR diverged from price) correlates with the size of the eventual move.
Bearish divergence on FINNIFTY
Bearish divergence: FINNIFTY futures making higher highs while PCR makes lower highs. Translation — price is rallying but call writers are getting more confident with each new high, capping the upside. Institutions are betting that Nifty Financial Services won't sustain above the current zone. Resolution is typically a pullback, especially if the divergence persists for 5+ sessions. Watch for the futures' first lower low after the divergence — that is the trigger.
Filtering noise from real signals
Not every PCR-vs-futures wiggle is a divergence. To filter noise on FINNIFTY, require three conditions: the divergence persists for at least 4-5 sessions, both PCR and futures move at least one full standard deviation from their running mean, and the divergence appears near the edges of the year-long PCR band. As of 29 September 2026, this filter dramatically reduces false signals on Nifty Financial Services compared to acting on every cross.
Nifty Financial Services (FINNIFTY) PCR Trend Around Expiry Rollovers
How does expiry rollover show up on the FINNIFTY trend?
Each daily PCR point uses the smallest live options expiry traded that day, so the underlying expiry naturally shifts. For FINNIFTY, that means a step from one weekly expiry to the next every Thursday for indexes, and one monthly to the next on the last Thursday for stocks. The trend chart is gap-aware — empty days render as breaks rather than zero values — but the rollover itself can produce small jumps when the new expiry has materially different positioning than the old one.
Reading rollover patterns on Nifty Financial Services
Rollover patterns on FINNIFTY reveal whether traders are maintaining, increasing, or unwinding their bias as positions move forward. A monthly PCR that closed at 1.2 and reopens the next month at 1.4 indicates institutions are rolling forward with stronger bullish positioning. The same chart but reopening at 0.9 means bullish conviction faded across the rollover. As a major Financial Services index on NSE, these rollover step-changes are some of the most informative individual data points on the year-long trend.
Filtering rollover noise from genuine sentiment shifts
Not every rollover step is a sentiment shift — some are mechanical, driven by which strikes are most actively traded in the new expiry. To filter noise on Nifty Financial Services, look at the next 3-5 sessions after a rollover. If PCR continues drifting in the rollover direction, the step represented a real shift. If it snaps back to the prior level, the step was mechanical. The trend chart's strength is exactly this — putting each step in the context of what came before and after.
Trading the post-rollover regime on FINNIFTY
As of 29 September 2026, the most useful application of rollover analysis on Nifty Financial Services is regime detection. After each monthly rollover, watch the first week of the new expiry to see whether FINNIFTY PCR settles into a higher band, a lower band, or the same band as before. The regime that establishes in that first week often persists for most of the new month. Sizing and direction of positional trades should align with the post-rollover regime rather than the pre-rollover one.
Nifty Financial Services (FINNIFTY) PCR Trend: Year-Long Sentiment Baseline
What does the FINNIFTY PCR Trend show?
The Nifty Financial Services (FINNIFTY) PCR Trend chart plots one Put-Call Ratio value per trading day across the last 365 sessions. Each point uses the smallest live options expiry that traded on that day — the nearest weekly for indexes, the nearest monthly for stocks — and divides total put open interest by total call open interest at the close. Layered on top is the futures close, so you read sentiment and price on the same axis. As a major Financial Services index on NSE, this view is what separates routine PCR levels from genuinely extreme ones.
Why a year-long view matters for FINNIFTY
A single intraday PCR snapshot has no context. A reading of 1.3 might be perfectly normal for Nifty Financial Services or a fresh six-month high — the snapshot can't tell you. The trend chart frames every reading inside the symbol's actual band over the last twelve months. You see at a glance whether today's value is mid-band, near the high edge (typically contrarian bearish for the next few sessions), or at the low edge (typically contrarian bullish).
Reading the FINNIFTY PCR band
For most Indian indexes the year-long PCR band sits roughly between 0.8 and 1.3. F&O stocks vary much more — some heavyweight names cluster between 0.6 and 1.0, others band 1.0 to 1.6 because of structural hedging by holders. The band is symbol-specific. Once you've watched FINNIFTY for a few months you'll know exactly where its neutral zone is, and any visit to the edges of that range becomes immediately actionable.
Today's FINNIFTY reading in context
As of 29 September 2026, locate the current FINNIFTY PCR on the trend line and ask three questions. Where is it inside the year-long band? Which direction has it been moving over the last 5-10 sessions? And is the futures overlay confirming or diverging? A PCR climbing toward the upper band while futures slide is the highest-information setup this chart produces — institutional put writers actively defending lower strikes against price weakness, the textbook bullish reversal signature on Nifty Financial Services.
FINNIFTY PCR trend: quick reference
| Position in 52-week PCR range | What it signals | Divergence to watch on the futures overlay |
|---|---|---|
| Near 52-week high | Extreme bullish positioning for FINNIFTY; put writers stretched | PCR stalling while futures keep rising: bull exhaustion, contrarian pullback risk |
| Upper quartile | Elevated bullish bias vs the past year | PCR rising with rising futures confirms the uptrend |
| Mid-band | Regime-typical, neutral positioning | No edge; wait for a move toward either extreme of the band |
| Lower quartile | Cautious tilt; call writers gaining ground | PCR falling with falling futures confirms the downtrend |
| Near 52-week low | Extreme call writing / capitulation for FINNIFTY | PCR turning up while futures still fall: potential bullish reversal |
Unlike a fixed textbook band, these zones are relative to FINNIFTY's own last-52-week PCR range, so a reading of 1.4 can be a fresh extreme on one symbol and mid-band on another. Read the position together with the futures overlay direction. The divergence column is where the year-long chart earns its edge over a single intraday snapshot.
How to use the PCR Trend tool
- Select an underlying — Choose Nifty, BankNifty, Sensex, or any F&O stock from the symbol selector. The chart loads the last 365 trading days of daily PCR with the futures close overlay.
- Read the year-long band — Note the typical PCR range for this symbol over the last year. Indexes usually band between 0.8 and 1.3; individual stocks vary much more widely. The band itself is symbol-specific context.
- Locate today's reading — Find where the current PCR sits inside the year-long band. Is it near the upper edge (extreme bullish positioning), lower edge (extreme call writing), or in the middle?
- Check for price divergence — Compare the PCR line direction against the futures overlay. PCR rising while futures fall, or PCR falling while futures rally, are the highest-information divergences on this chart.
- Confirm with intraday tools — Pair the trend signal with our intraday Put-Call Ratio tool, Max Pain, and Open Interest analysis before structuring a trade. The trend gives you regime; the intraday tools give you timing.
FINNIFTY PCR Trend — Frequently Asked Questions
What does the FINNIFTY PCR trend tell traders?
The FINNIFTY PCR trend plots the daily put-to-call open-interest ratio over the last year. Rising PCR over weeks signals accumulating put writing, which usually means Indian institutions are positioning bullishly and defending lower strikes. Falling PCR signals call writers gaining ground and a more cautious tilt. Comparing the trend against the futures price overlay reveals whether sentiment is leading or lagging the move.
How is daily FINNIFTY PCR calculated here?
For each trading day we sum put open interest across all strikes and divide by the sum of call open interest, using the smallest options expiry that traded that day. For FINNIFTY this is typically the nearest weekly expiry for indexes and the nearest monthly expiry for stocks.
When is FINNIFTY PCR considered extreme?
Historically, FINNIFTY PCR readings above 1.5 mark extreme bullish positioning that often precedes pullbacks (contrarian), and readings below 0.5 mark extreme call writing that can precede bounces. The neutral zone is roughly 0.8 to 1.2. The 365-day window helps you judge whether today's value is a fresh extreme for this symbol or a routine reading.
Why does the FINNIFTY PCR trend overlay the futures price?
The futures overlay turns positioning into a divergence detector. Comparing the FINNIFTY PCR line against the monthly futures close reveals whether sentiment leads or lags price. Rising PCR while futures slide is a bullish setup, with put writers building a floor under the market. Falling PCR while futures rally warns of call writers capping the upside. These divergences stay invisible on a stand-alone PCR chart.
How often does the FINNIFTY PCR trend update?
The FINNIFTY PCR trend adds one new point per NSE trading session, using that day's closing put-to-call open-interest ratio. During market hours the latest point refreshes as live open interest changes; after 3:40 PM IST it settles to the final close. The chart always shows a rolling 365-day window, so the oldest session drops off as each new day is added.