KOTAKBANK Option Chain 2026 - Live & Historical OI & Greeks
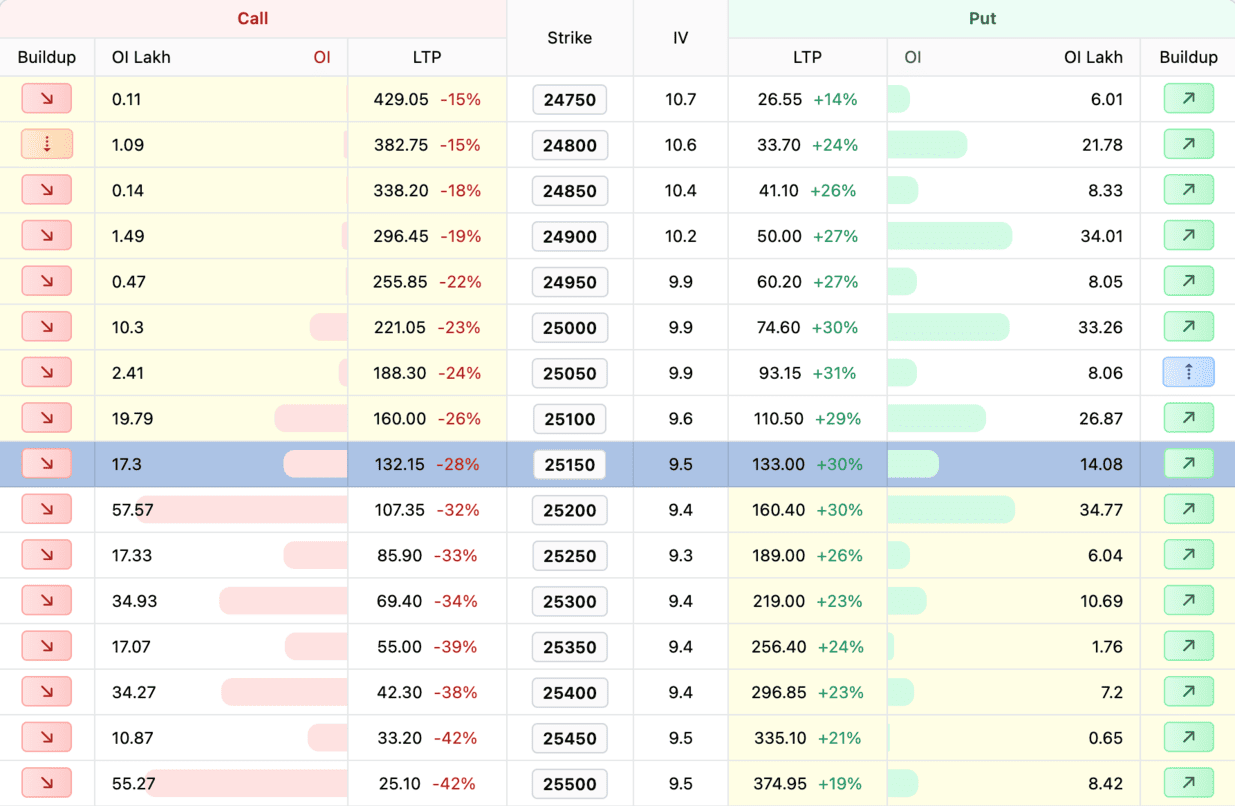
View live and historical KOTAKBANK option chain with real-time prices, open interest, volume, and Greeks. Switch to Historical Mode to replay past data for any trading date. Track all strikes and expiries in one place.
Kotak Mahindra Bank Ltd (KOTAKBANK) Option Chain: LTP, LTP Change, and Premium Tracking
What does LTP mean in the KOTAKBANK option chain?
LTP (Last Traded Price) is the most recent premium at which a KOTAKBANK option contract was traded. In the KOTAKBANK option chain, the LTP column is centre-stage for both call and put sides, with a chart button next to it. The LTP represents the actual market price of the option right now. When you click the chart icon, you can see how the premium at that specific Kotak Mahindra Bank Ltd strike has moved throughout the session — invaluable for timing entries and exits.
What does LTP Change tell you?
LTP Change shows how much the option premium has moved from the previous session's close — in absolute rupees and percentage. In the KOTAKBANK chain, positive LTP change (green) means the option is more expensive today. Negative (red) means cheaper. For call options: if KOTAKBANK price went up and call LTP also went up, that is expected. But if KOTAKBANK went up and call LTP went down, it signals IV crush or theta decay overwhelming the price move — a warning that buying was not profitable despite correct direction. The LTP Change column reveals whether Kotak Mahindra Bank Ltd option prices are following the expected Delta behaviour.
Using the LTP chart feature for KOTAKBANK
Each LTP cell in the KOTAKBANK option chain has a chart button. Clicking it opens a real-time premium chart for that specific strike. This is powerful because you can see how the premium moved tick by tick during the session. Sharp premium spikes indicate aggressive buying. Steady decline signals theta decay or IV contraction. The chart helps you identify optimal entry and exit points for Kotak Mahindra Bank Ltd options — buy on premium dips, sell on premium spikes, rather than relying solely on the underlying price.
Live vs Historical LTP in the KOTAKBANK chain
The KOTAKBANK option chain supports both Live and Historical modes. In Live mode, LTP updates in real-time during market hours — you see every premium change as it happens. In Historical mode, you can replay how premiums looked at any past date, which is valuable for backtesting. For Kotak Mahindra Bank Ltd, comparing today's LTP against historical levels for similar strikes helps you assess whether current premiums are cheap or expensive. Kotak Mahindra Bank Ltd historical data helps you understand how premiums behaved around past earnings and events.
Kotak Mahindra Bank Ltd (KOTAKBANK) Option Chain: How to Spot Breakout and Reversal Signals
Breakout signals from the KOTAKBANK option chain
A breakout happens when KOTAKBANK price pushes through a high-OI level with conviction. The option chain shows this before it is obvious on price charts. Watch for: (1) OI at a key resistance/support strike starts dropping (the wall is crumbling). (2) OI Change turns sharply negative at that strike. (3) Buildup shifts from Short to Short Covering at call strikes (sellers are running) or from Long to Long Unwinding at put strikes. (4) Volume spikes above average. When all four signals appear simultaneously in the Kotak Mahindra Bank Ltd chain, a breakout is imminent or already underway.
Reversal signals using KOTAKBANK OI and Buildup data
Reversals in KOTAKBANK show up when OI and price diverge. If Kotak Mahindra Bank Ltd is making new highs but total call OI is increasing (more call writing) while put OI is falling (put sellers exiting), the option chain is signaling that smart money does not believe the rally. Similarly, if KOTAKBANK is falling but fresh put writing appears (Short Buildup on puts), option sellers are betting the fall is limited. The Buildup column across multiple strikes gives a quick sentiment read — if most ATM call strikes show "Short Covering" while most put strikes show "Short Buildup", the market is quietly turning bullish for Kotak Mahindra Bank Ltd.
Using PCR trend as a reversal indicator for KOTAKBANK
Track the KOTAKBANK PCR over multiple sessions. A steadily rising PCR (over 3-5 sessions) means put sellers are systematically building bullish positions. When this rising trend suddenly breaks (PCR drops sharply after days of increases), it signals that the bullish positioning has peaked — a potential reversal signal. Similarly, a sustained PCR decline that suddenly reverses upward signals a bottom. The KOTAKBANK option chain's PCR data captures this trend directly. Extreme PCR readings (above 1.4 or below 0.5 for stock options) are classic contrarian reversal signals.
Combining chart patterns with KOTAKBANK option chain data
The most powerful trading setups for Kotak Mahindra Bank Ltd come from combining price chart patterns with option chain confirmation. If the KOTAKBANK chart shows a double bottom pattern AND the option chain shows fresh put writing at the bottom level AND PCR is rising — that is triple confirmation for a bullish reversal. If the chart shows a head-and-shoulders top AND call OI is expanding at the right shoulder strike AND Buildup shows Short Buildup on calls — triple confirmation for a bearish breakdown. Option chain data transforms chart pattern trading from probability-based to conviction-based. As of 27 July 2026, check both your KOTAKBANK charts and the option chain for any such confluence setups.
Kotak Mahindra Bank Ltd (KOTAKBANK) Option Chain: Greeks — Delta, Theta, Gamma, Vega
What is Delta in the KOTAKBANK option chain?
Delta measures how much the KOTAKBANK option premium changes when the underlying moves by 1 point. In the KOTAKBANK chain, Delta ranges from 0 to 1 for calls and 0 to -1 for puts. ATM options have Delta near 0.5 — a 1-point KOTAKBANK move changes the premium by about 0.50. Deep ITM options have Delta near 1.0 (moving point-for-point). Far OTM options have Delta near 0 (barely reacting). Use Delta to choose strikes: high-conviction traders pick high-Delta ITM options. Budget-conscious traders pick low-Delta OTM.
What is Theta and how it affects KOTAKBANK option prices daily
Theta is the daily time decay — how much premium the KOTAKBANK option loses each day just from time passing. In the option chain, ATM strikes show the highest Theta because they have the most time value to lose. Theta is always negative for option buyers (you lose money daily) and positive for sellers (you earn money daily). For Kotak Mahindra Bank Ltd options, Theta accelerates in the last 5 days before expiry — the final week accounts for roughly half of total decay. If Theta at your KOTAKBANK strike shows -5, your option loses approximately Rs. 5 per share per day. This is why timing matters enormously for option buyers.
What Gamma reveals about KOTAKBANK options near expiry
Gamma measures how fast Delta changes as KOTAKBANK moves. It is highest for ATM options near expiry. In the KOTAKBANK chain, high Gamma strikes are the most reactive — small underlying moves cause large premium swings. On expiry day, Gamma at ATM KOTAKBANK options can be extremely high. This means a 50-point move could turn a Rs. 5 option into Rs. 50, or vice versa. For sellers, high Gamma is dangerous — the risk of sudden loss spikes. For buyers, it is an opportunity for outsized returns with small capital. Always check Gamma in the KOTAKBANK chain before trading near-expiry options.
How Vega in the KOTAKBANK chain helps you trade volatility
Vega tells you how much premium changes for a 1% change in IV. In the KOTAKBANK option chain, ATM options typically have the highest Vega. If Vega is 10 and IV rises by 2%, the premium increases by Rs. 20 — regardless of what KOTAKBANK price does. Before major events (Kotak Mahindra Bank Ltd's earnings, board meetings), IV rises and Vega works in favour of option holders. After events, IV crushes and Vega works against them. The KOTAKBANK chain shows both IV and Vega at every strike — use Vega to estimate how much a potential IV change will affect your position's value.
Option Chain: Video Walkthrough
KOTAKBANK option chain OI: quick reference
| OI signal in the chain | Where to look | What it means for KOTAKBANK |
|---|---|---|
| Highest Call OI | Strike above spot with peak call OI | Key resistance; expected ceiling before expiry |
| Highest Put OI | Strike below spot with peak put OI | Key support; expected floor before expiry |
| Rising Call OI (+ Chg OI) | Call side of a strike | Fresh call writing; resistance building at that level |
| Rising Put OI (+ Chg OI) | Put side of a strike | Fresh put writing; support building at that level |
| Falling Call OI (− Chg OI) | Call side unwinding | Short covering; resistance weakening, upside room |
| Falling Put OI (− Chg OI) | Put side unwinding | Support being pulled; downside risk rising |
Read these from the live chain's OI and change-in-OI (Chg OI) columns. The widest Call and Put OI clusters bracket the expected KOTAKBANK range for the expiry, while the Chg OI column tells you whether a level is being reinforced or unwound. OI concentration can shift through the session, so re-check the chain as expiry approaches.
How StockMojo calculates KOTAKBANK option chain data
StockMojo sources the KOTAKBANK option chain from the live NSE data feed. During market hours (09:15–15:30 IST) the chain refreshes continuously as new ticks arrive; outside market hours it shows the last session's closing snapshot. Historical mode replays the full chain for any past trading date.
Derived columns are recomputed on every refresh rather than cached: change in OI is measured against the previous session's close, the Buildup classification combines the direction of price change with the direction of OI change, and the Put-Call Ratio is total put OI divided by total call OI across active strikes.
Implied volatility and the Greeks (Delta, Gamma, Theta, Vega) are recalculated from the Black-Scholes model on each refresh, using the live underlying price, each contract's strike and time to expiry, and the prevailing risk-free rate — so displayed values reflect current market conditions rather than delayed snapshots.
How to use the StockMojo Option Chain
- Pick a symbol — Type or select Nifty, BankNifty, FinNifty, or any F&O stock in the symbol search at the top.
- Choose your expiry — Use the expiry dropdown to switch between weekly and monthly contracts. The current week is selected by default.
- Identify the ATM strike — Find the highlighted at-the-money strike — this is your reference point for reading OI and IV across the chain.
- Scan OI and Change in OI — Look for strikes with the highest call OI (resistance) and put OI (support). Check Change in OI to see where new positions are being built right now.
- Cross-reference with Max Pain and PCR tools — Open Max Pain and Put Call Ratio in adjacent tabs to confirm whether the OI picture aligns with broader sentiment.
KOTAKBANK Option Chain — Frequently Asked Questions
How to read KOTAKBANK option chain?
The KOTAKBANK option chain shows all available options with their strike prices, premiums, open interest and volume. Calls are on the left, puts on the right. High OI at a strike indicates strong support/resistance. Use the chain to analyze market sentiment and plan your trades.
What is KOTAKBANK open interest in option chain?
Open Interest (OI) in KOTAKBANK option chain shows total outstanding contracts at each strike. Rising OI with rising price = bullish (long buildup). Rising OI with falling price = bearish (short buildup). Concentration of Put OI suggests support, Call OI suggests resistance.
Which strike to buy in KOTAKBANK options?
For KOTAKBANK options, ATM strikes have highest theta decay but most responsive to price moves. ITM options cost more but have less time decay risk. OTM options are cheaper but need larger moves. Consider your trade duration, risk tolerance and view strength when selecting strikes.
Can I view historical option chain data for KOTAKBANK?
Yes, switch to Historical Mode to view past KOTAKBANK option chain data for any trading date. You can replay OI, volume, and premium snapshots as they appeared on a specific date and expiry. This is useful for back-testing strategies and studying how OI build-up evolved before key KOTAKBANK moves.
What does IV mean in the KOTAKBANK option chain?
IV (implied volatility) in the KOTAKBANK option chain is the market's expected volatility priced into each strike's premium. Higher IV means costlier options and a wider expected move. Compare call and put IV across strikes to spot skew — richer OTM put IV signals downside-hedging demand. IV typically spikes before KOTAKBANK events and cools off afterwards.