AXISBANK Option Chain 2026 - Live & Historical OI & Greeks
View live and historical AXISBANK option chain with real-time prices, open interest, volume, and Greeks. Switch to Historical Mode to replay past data for any trading date. Track all strikes and expiries in one place.
Axis Bank Ltd (AXISBANK) Option Chain: Live Mode vs Historical Mode
What is Live Mode in the AXISBANK option chain?
Live Mode shows real-time AXISBANK option data that updates every second during market hours (9:15 AM - 3:30 PM IST). Every column — OI, OI Change, Volume, LTP, IV, Greeks, Buildup, PCR — refreshes as trades happen. The Axis Bank Ltd chain in Live Mode is your primary tool during trading hours. You can see exactly where OI is building, which strikes are being traded, and how premiums are moving. For Axis Bank Ltd, live data captures both institutional and retail activity.
What is Historical Mode and why you need it
Historical Mode lets you replay the AXISBANK option chain as it appeared on any past trading date. You select a date and expiry, and the chain shows the exact OI, premiums, IV, and Greeks from that day. This is invaluable for: backtesting your analysis framework against actual past data, studying how OI built up before major Axis Bank Ltd moves, understanding how premiums behaved around past events, and learning what signals worked and which failed. Historical mode turns the AXISBANK option chain into a training simulator.
Switching expiries in the AXISBANK option chain
The AXISBANK option chain lets you switch between different expiry dates. Axis Bank Ltd typically has monthly expiry options available. Always compare OI across expiries. If the current expiry shows resistance at a strike but the next month shows support at a higher level, it reveals a short-term vs medium-term divergence. The expiry selector in the AXISBANK chain makes this cross-expiry comparison quick and easy.
Previous Day comparison and Time Cycle in the AXISBANK chain
The AXISBANK option chain includes a previous-day comparison feature (Time Cycle). This overlays yesterday's OI data on today's, so you can instantly see how positioning has changed overnight. If a strike had 50 lakh OI yesterday and shows 55 lakh today, 5 lakh contracts were added — fresh positioning. If it dropped to 45 lakh, 5 lakh were closed. This comparison is more intuitive than just reading OI Change numbers because you see the before-and-after side by side. For Axis Bank Ltd, comparing today vs yesterday reveals which levels institutions are defending versus abandoning.
Axis Bank Ltd (AXISBANK) Option Chain: What is Open Interest (OI) and How to Read It
What does OI mean in the AXISBANK option chain?
Open Interest (OI) is the total number of active option contracts at each strike price that have not yet been closed, exercised, or expired. In the AXISBANK option chain, the OI column on the call side shows how many call contracts are outstanding, and the put side shows put contracts. Unlike volume which resets daily, OI accumulates across sessions — it tells you where traders have committed real money and are holding positions overnight. When you see the OI bar visually growing at a particular strike, it means that strike is becoming a key level for Axis Bank Ltd.
How to identify support and resistance using AXISBANK OI
The strike with the highest put OI is your strongest support level — put sellers at that strike collected premium and are betting AXISBANK will stay above it. They will defend this level. The strike with the highest call OI is your strongest resistance — call sellers believe AXISBANK won't cross that level. The OI bar chart in the AXISBANK option chain visually highlights these concentrations. The range between the highest put OI and highest call OI defines the expected trading range for Axis Bank Ltd until expiry. For Axis Bank Ltd, a Private Bank sector stock, these levels can shift around earnings or sector events.
What does the OI Rank indicator tell you?
In the AXISBANK option chain, the OI column shows a rank badge (like #1, #2, #3) next to certain strikes. This rank highlights which strikes have the highest OI across the entire chain — the #1 ranked call OI strike is your primary resistance, and the #1 ranked put OI strike is your primary support. These top-ranked levels are the most important to watch because they represent the largest financial commitments. If the #1 OI strike changes from one session to the next, the market's structural levels are shifting — a significant signal.
ITM Total, OTM Total, and Total OI in the AXISBANK chain
The summary rows at the bottom of the AXISBANK option chain show ITM Total (all in-the-money OI), OTM Total (all out-of-the-money OI), and the overall Total. Comparing ITM vs OTM open interest reveals market positioning. If OTM put OI is much larger than OTM call OI, more put writing is happening below the current AXISBANK price — generally bullish. If OTM call OI dominates, more call writing above is creating a cap — bearish. The total OI number gives you a sense of overall market participation in Axis Bank Ltd options for this expiry. Higher total OI means more liquid, more reliable levels. As a NIFTY and BANKNIFTY and FINNIFTY constituent, AXISBANK typically has deep OI participation making these totals meaningful.
Axis Bank Ltd (AXISBANK) Option Chain: Max Pain — The Strike Marker That Predicts Expiry
What is the Max Pain marker in the AXISBANK option chain?
In the AXISBANK option chain, the Max Pain strike is marked with a special "Max Pain" badge next to the strike number. This strike represents the price level where option buyers (both call and put holders) would lose the maximum total money if Axis Bank Ltd settles there at expiry. Conversely, it is where option sellers collectively pay out the least. The AXISBANK option chain calculates this by summing the total intrinsic value payout to all option holders at each strike and finding the one with the minimum combined loss.
Does AXISBANK actually settle near Max Pain?
Market studies and trader experience show that stock options like Axis Bank Ltd converge toward max pain with somewhat lower reliability than index options, roughly 40-50% of the time. The effect is strongest in the last 2-3 trading sessions before expiry and in range-bound markets. It works because option sellers (market makers) hedge their positions by trading the underlying, and this hedging activity creates a natural pull toward the max pain level. During strong trends or surprise events, max pain can fail entirely.
How to use Max Pain in your AXISBANK trading
If AXISBANK is currently trading above max pain, there is a gravitational pull downward — the probability of the price easing toward that level increases as expiry approaches. If below max pain, the pull is upward. The AXISBANK option chain makes this comparison easy — just compare the current underlying price (shown in the LTP display) with the Max Pain tagged strike. The distance between them tells you the expected magnitude of the pull. For expiry-day trading: if AXISBANK opens near max pain, expect range-bound action. If it opens far from max pain, expect a drift in that direction.
When to trust and when to ignore AXISBANK Max Pain
Trust max pain for Axis Bank Ltd when: total OI is high, the pain level has been stable for 3+ sessions, VIX is moderate, and there is no major event imminent. Ignore max pain when: OI is rapidly shifting (max pain moves daily), a strong directional trend overrides hedging flows, there is an upcoming earnings announcement, corporate action, or sector news, or overall OI is unusually low for AXISBANK. The max pain marker in the option chain is a helpful reference point, not a guaranteed target. Use it alongside OI levels, PCR, and Buildup data for the most informed Axis Bank Ltd trading decisions. As of 27 July 2026, check where max pain sits relative to the current AXISBANK price.
Option Chain: Video Walkthrough
AXISBANK option chain OI: quick reference
| OI signal in the chain | Where to look | What it means for AXISBANK |
|---|---|---|
| Highest Call OI | Strike above spot with peak call OI | Key resistance; expected ceiling before expiry |
| Highest Put OI | Strike below spot with peak put OI | Key support; expected floor before expiry |
| Rising Call OI (+ Chg OI) | Call side of a strike | Fresh call writing; resistance building at that level |
| Rising Put OI (+ Chg OI) | Put side of a strike | Fresh put writing; support building at that level |
| Falling Call OI (− Chg OI) | Call side unwinding | Short covering; resistance weakening, upside room |
| Falling Put OI (− Chg OI) | Put side unwinding | Support being pulled; downside risk rising |
Read these from the live chain's OI and change-in-OI (Chg OI) columns. The widest Call and Put OI clusters bracket the expected AXISBANK range for the expiry, while the Chg OI column tells you whether a level is being reinforced or unwound. OI concentration can shift through the session, so re-check the chain as expiry approaches.
How StockMojo calculates AXISBANK option chain data
StockMojo sources the AXISBANK option chain from the live NSE data feed. During market hours (09:15–15:30 IST) the chain refreshes continuously as new ticks arrive; outside market hours it shows the last session's closing snapshot. Historical mode replays the full chain for any past trading date.
Derived columns are recomputed on every refresh rather than cached: change in OI is measured against the previous session's close, the Buildup classification combines the direction of price change with the direction of OI change, and the Put-Call Ratio is total put OI divided by total call OI across active strikes.
Implied volatility and the Greeks (Delta, Gamma, Theta, Vega) are recalculated from the Black-Scholes model on each refresh, using the live underlying price, each contract's strike and time to expiry, and the prevailing risk-free rate — so displayed values reflect current market conditions rather than delayed snapshots.
How to use the StockMojo Option Chain
- Pick a symbol — Type or select Nifty, BankNifty, FinNifty, or any F&O stock in the symbol search at the top.
- Choose your expiry — Use the expiry dropdown to switch between weekly and monthly contracts. The current week is selected by default.
- Identify the ATM strike — Find the highlighted at-the-money strike — this is your reference point for reading OI and IV across the chain.
- Scan OI and Change in OI — Look for strikes with the highest call OI (resistance) and put OI (support). Check Change in OI to see where new positions are being built right now.
- Cross-reference with Max Pain and PCR tools — Open Max Pain and Put Call Ratio in adjacent tabs to confirm whether the OI picture aligns with broader sentiment.
AXISBANK Option Chain — Frequently Asked Questions
How to read AXISBANK option chain?
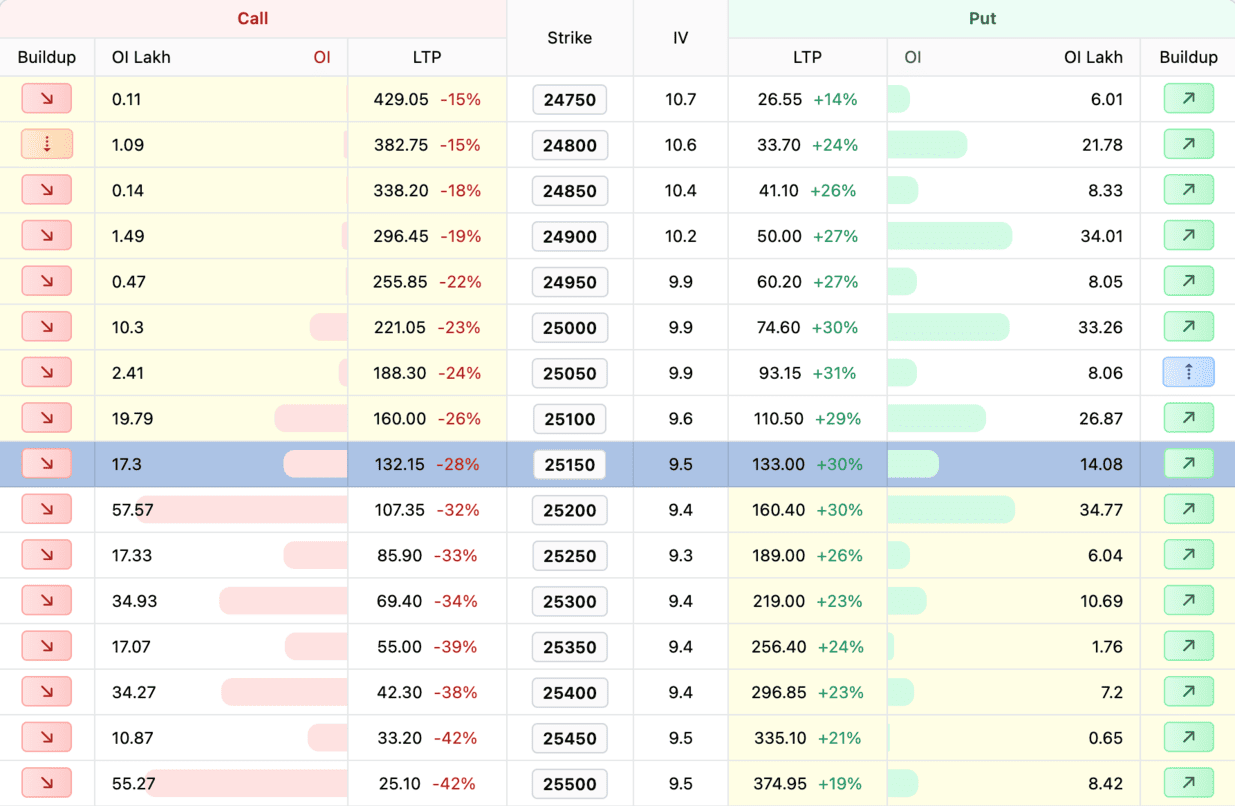
The AXISBANK option chain shows all available options with their strike prices, premiums, open interest and volume. Calls are on the left, puts on the right. High OI at a strike indicates strong support/resistance. Use the chain to analyze market sentiment and plan your trades.
What is AXISBANK open interest in option chain?
Open Interest (OI) in AXISBANK option chain shows total outstanding contracts at each strike. Rising OI with rising price = bullish (long buildup). Rising OI with falling price = bearish (short buildup). Concentration of Put OI suggests support, Call OI suggests resistance.
Which strike to buy in AXISBANK options?
For AXISBANK options, ATM strikes have highest theta decay but most responsive to price moves. ITM options cost more but have less time decay risk. OTM options are cheaper but need larger moves. Consider your trade duration, risk tolerance and view strength when selecting strikes.
Can I view historical option chain data for AXISBANK?
Yes, switch to Historical Mode to view past AXISBANK option chain data for any trading date. You can replay OI, volume, and premium snapshots as they appeared on a specific date and expiry. This is useful for back-testing strategies and studying how OI build-up evolved before key AXISBANK moves.
What does IV mean in the AXISBANK option chain?
IV (implied volatility) in the AXISBANK option chain is the market's expected volatility priced into each strike's premium. Higher IV means costlier options and a wider expected move. Compare call and put IV across strikes to spot skew — richer OTM put IV signals downside-hedging demand. IV typically spikes before AXISBANK events and cools off afterwards.