PSU BANK Advance Decline Ratio - Live Market Breadth Indicator
Track live advance decline ratio for PSU BANK. Monitor how many stocks are advancing vs declining to gauge market breadth and sentiment.
Advance / Decline
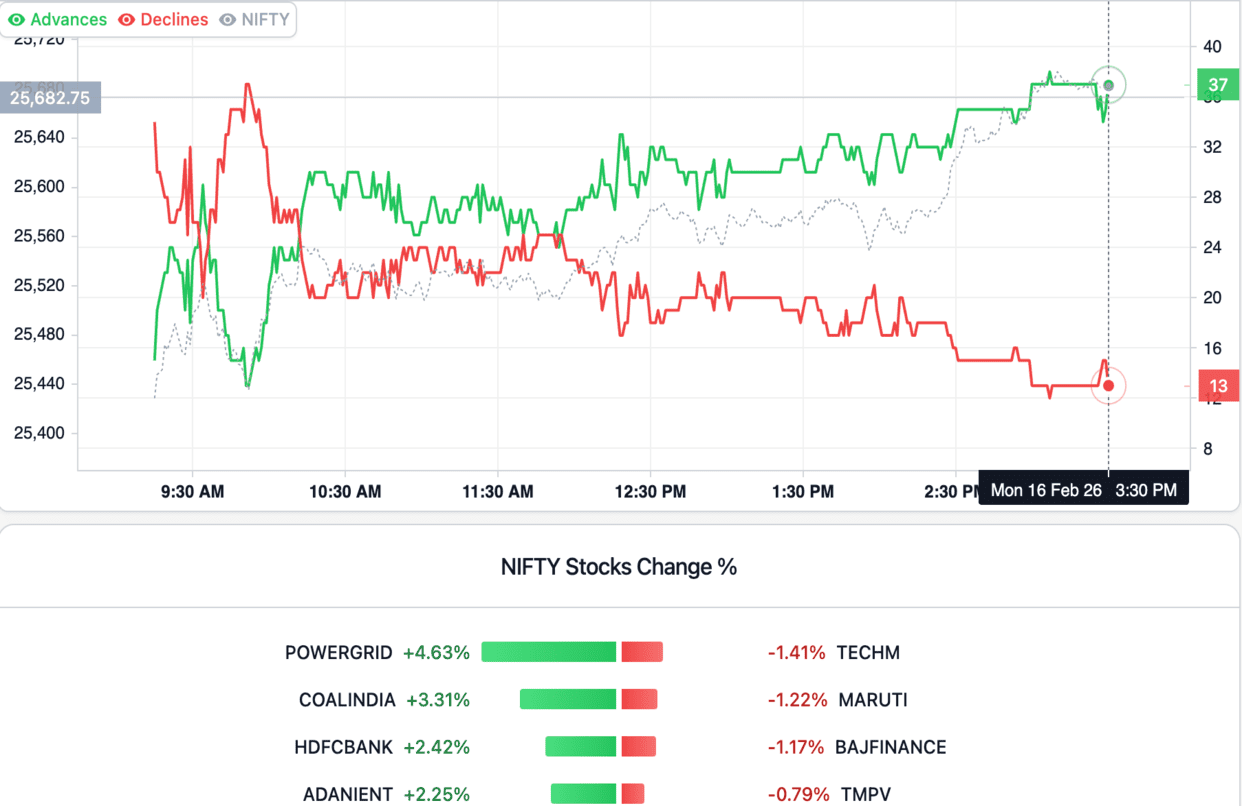
PSU BANK Advance / Decline
PSU BANK Stocks Change %
Frequently Asked Questions about PSU BANK Advance Decline
What does the Advance Decline Ratio indicate?
How to read the Advance Decline Chart?
Does the Advance Decline Ratio show bullish or bearish divergence?
How do corporate earnings impact the Advance Decline Ratio?
The Ultimate Guide to PSU BANK Advance Decline Ratio
What is the PSU BANK Advance Decline Ratio?
The Advance Decline Ratio (ADR) is a key market breadth indicator used by traders to gauge the overall health of the PSU BANK. It simply compares the number of constituent stocks that are advancing (trading higher than their previous close) to the number of stocks that are declining.
A ratio above 1.0 indicates more stocks are rising, signaling a bullish market sentiment, while a ratio below 1.0 indicates more stocks are falling, signaling a bearish market sentiment. By tracking the advance decline ratio today, traders can look past the surface index price to see what the majority of stocks are actually doing.
Why Traders Use the Advance Decline Chart
- Market Sentiment & Breadth: Market breadth is crucial because it reveals the underlying strength of a price move. If the PSU BANK is rising, but only a few heavy-weight stocks are pulling the index up while the majority fall (a narrow rally), the move might be fragile and prone to a reversal.
- Early Warning Signs (Divergence): One of the most powerful uses of the live advance decline chart is spotting divergence. If the PSU BANK hits a new high for the day, but the ADR forms a lower high, this bearish divergence often precedes a market reversal or profit booking.
- Sector Rotation: Successful intraday traders use sector-wise advance-decline data to identify trending sectors. By aligning their trades with sectors showing strong advancing participation, they maximize momentum.
Advance Decline Across Different Market Segments
While the broader NSE advance decline ratio gives a macro view, segment-specific data is highly actionable:
- Banking & Financials: Tracking Fin Nifty or Bank Nifty breadth shows whether credit and lending sentiment is robust, often acting as a leading indicator for the broader Nifty 50.
- Midcap & Smallcap: Checking the Midcap advance decline ratio helps gauge institutional risk appetite. A high advancing ratio here suggests traders are aggressively taking "Risk-On" positions.
- F&O Stocks: Derivative traders monitor the F&O segment breadth specifically to track high-liquidity stocks where smart money is most active.
PSU BANK Advance Decline Snapshot
Data as of 21 Aug 2026, 3:30 pm IST. The tool above shows live values during market hours; this snapshot refreshes with every site update.
As of 21 Aug 2026, 3:30 pm IST, 6 PSU BANK stocks were advancing and 6 were declining versus the previous close — an advance-decline ratio of 1.00. PSU BANK was at 8,620.00, up 3.4 points (+0.04%).
| Metric | Value |
|---|---|
| Advancing stocks | 6 |
| Declining stocks | 6 |
| Advance-decline ratio | 1.00 |
| PSU BANK | 8,620.00 (+0.04%) |
Top Gainers
| Stock | Change |
|---|---|
| BANKBARODA | +1.02% |
| CENTRALBK | +0.71% |
| INDIANB | +0.68% |
| PSB | +0.34% |
| CANBK | +0.28% |
Top Losers
| Stock | Change |
|---|---|
| PNB | -1.23% |
| UNIONBANK | -0.67% |
| IOB | -0.45% |
| UCOBANK | -0.35% |
| MAHABANK | -0.02% |